 PhenoRoam
Lasse Klingbeil
Type of resources
Contact for the resource
Provided by
-
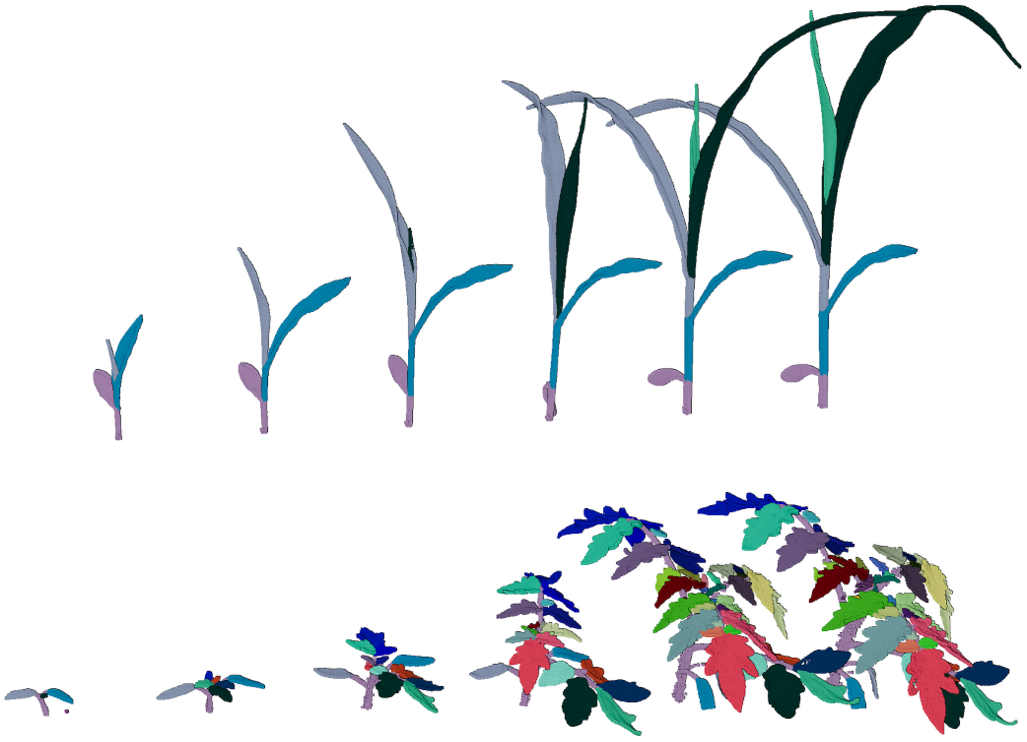
The dataset contains 7 maize plants measured on 12 days. This gives 84 maize point clouds (about 90 Mio. points). From these, 49 point clouds (about 60 Mio. points) are labeled. Furthermore, the dataset contains 7 tomato plants measured on 20 days (about 350 Mio. points). This gives 140 point clouds from which 77 point clouds (200 Mio. points) are labeled. Note that we provide temporally consistent labels for each point in the clouds. We provide labeled and unlabeled point clouds, the file name indicates whether the point cloud is annotated or not. For example, M01_0313_a.xyz is labeled, M01_0314.xyz is not labeled. For the tomato plant point clouds, each annotated file contains the x,y,z coordinates, and the label associated with the point. For the maize point clouds. Each file annotated contains the x,y,z coordinates, and the 2 labels associated with the point. For both species, if no labels are provided, the files contain only the x,y,z coordinates. Cite: D. Schunck, F. Magistri, R. A. Rosu, A. Cornelißen, N. Chebrolu, S. Paulus, J. Léon, S. Behnke, C. Stachniss, H. Kuhlmann, and L. Klingbeil, “Pheno4D: A spatio-temporal dataset of maize and tomato plant point clouds for phenotyping and advanced plant analysis,” PLOS ONE, vol. 16, iss. 8, pp. 1-18, 2021. doi:10.1371/journal.pone.0256340.